

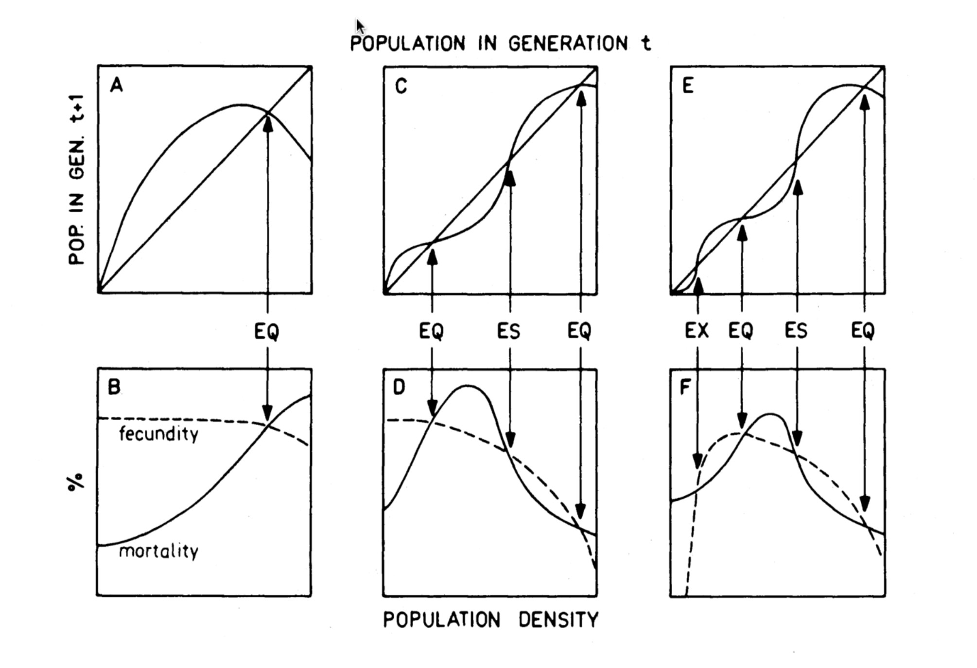
Diagram from C. S. Holling” Resilience and Stability of Ecological Systems” demonstrating various theoretical population curves (A,C,E) and their derivation dependent on different projections of fecundity and morbidity (B,D,F).
Diagram from C. S. Holling” Resilience and Stability of Ecological Systems” demonstrating various theoretical population curves (A,C,E) and their derivation dependent on different projections of fecundity and morbidity (B,D,F).